HYBO Energy
Energy system performance describes how effectively a building, facility, or industrial site converts energy into useful services. Those services include lighting, heating, cooling, production, comfort, and reliability. A low utility bill does not always prove strong performance. Mild weather, reduced occupancy, or delayed maintenance can create a misleading result.
The International Energy Agency reported in Energy Efficiency 2024 that global energy intensity improved by about 2.1% in 2023. However, the annual improvement remains below the 4% rate required to achieve the COP28 efficiency goal by 2030. This gap makes accurate evaluation more than a financial exercise. It connects operational decisions with emissions, resilience, and long-term energy security. The U.S. Department of Energy also emphasizes measured energy use, weather normalization, benchmarking, and continuous improvement through its building performance resources.
How To Evaluate Energy System Performance requires a clear baseline and dependable evidence. Start with interval meter data, equipment schedules, indoor temperatures, production output, and peak-demand records. Compare current results with historical performance, weather conditions, occupancy, and relevant industry benchmarks. Then examine key indicators, such as energy use intensity, seasonal efficiency, carbon emissions, operating cost, fault frequency, and occupant comfort.
The details matter. A chiller may consume excessive power during a quiet afternoon. A sensor may report comfortable temperatures while one occupied room remains cold. ISO 50001 supports a structured energy management approach, but certification alone cannot guarantee efficient operation. No metric is perfect. A practical evaluation combines engineering inspection, verified data, staff experience, and repeated measurement. Some conclusions will remain uncertain, and that uncertainty deserves documentation rather than concealment.
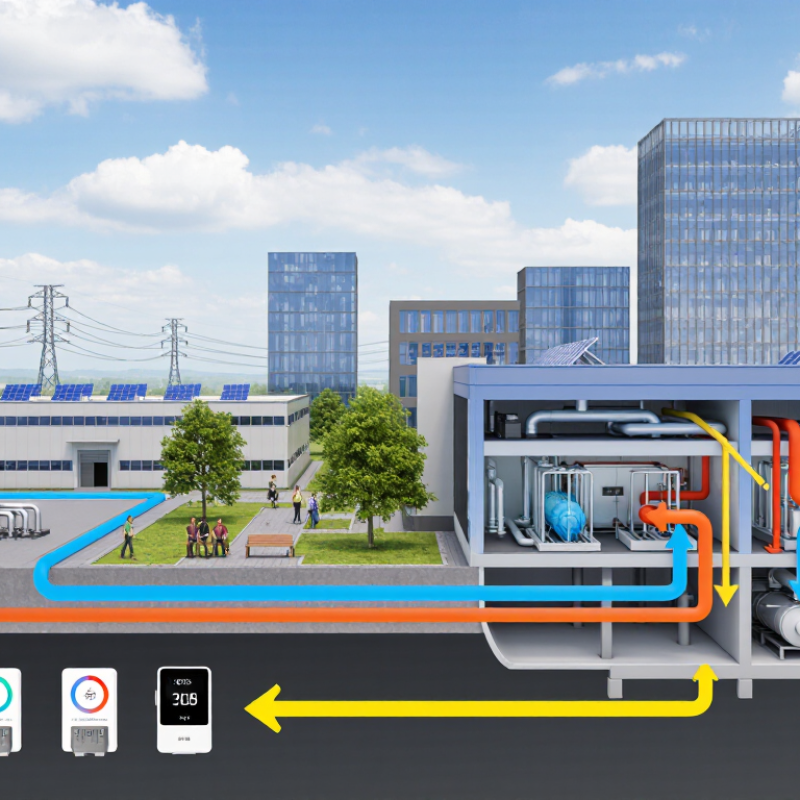
What Is Energy System Performance and How to Evaluate It?
Define Energy System Performance Through ISO 50001 and Energy Intensity
Energy system performance is not simply lower consumption. Under ISO 50001, it means controlling and improving energy results through measurable energy performance indicators, or EnPIs. An EnPI may track kilowatt-hours per tonne, square metre, or production hour. The energy baseline shows whether improvement is real. Numbers need context.
The International Energy Agency reported a 2.1% improvement in global energy intensity during 2022. Its Net Zero Roadmap 2023 indicates that annual intensity improvements must approach 4% through 2030. These figures create pressure for practical measurement. Yet a global average says little about one facility. Weather, occupancy, product mix, and operating hours can change results.
ISO 50001:2018 supports a cycle of monitoring, analysis, and performance evaluation. A useful review compares current EnPIs with a documented baseline and relevant variables. A cold week can distort heating data. A quiet production month can create false savings. A perfect baseline is rare. That is acceptable when assumptions are recorded and reviewed. Missing meters remain a serious weakness. Data quality often determines whether an energy project is trusted.
| Performance Dimension | ISO 50001-Relevant Definition | Calculation or Measurement Method | Typical Unit | How to Evaluate Performance |
|---|---|---|---|---|
| Total Energy Consumption | The total quantity of energy used within the defined organizational and operational boundaries. | Add electricity, fuels, steam, heat, cooling, and other relevant energy carriers after applying consistent conversion factors. | kWh, MWh, GJ, or fuel-specific units | Compare against the energy baseline, production volume, operating hours, weather, or other relevant variables. |
| Energy Intensity | Energy use relative to a meaningful activity, output, floor area, distance, or service delivered. | Energy intensity = total energy consumption ÷ relevant activity or output. | kWh per unit of output, kWh/m², MJ per tonne, or kWh per operating hour | A decreasing normalized intensity generally indicates improved energy performance, provided product quality and operating conditions remain acceptable. |
| Energy Performance Indicator (EnPI) | A quantitative measure or metric selected to monitor and evaluate energy performance. | Select an indicator that reflects significant energy uses, relevant variables, and organizational objectives. | Depends on the indicator | Review trends over time and compare actual results with the baseline, objectives, targets, and expected performance. |
| Energy Baseline (EnB) | A quantitative reference used to compare energy performance across defined periods or operating conditions. | Establish from reliable historical data and adjust when relevant variables, boundaries, methods, or major changes materially affect performance. | kWh/year, MWh/year, or normalized EnPI value | Use a documented baseline period and maintain traceable assumptions, data sources, and adjustment rules. |
| Energy Performance Improvement | A measurable improvement in energy-related results compared with the applicable baseline. | Improvement (%) = [(baseline-adjusted performance − current performance) ÷ baseline-adjusted performance] × 100. | % | Confirm that the improvement is based on comparable conditions and supported by measured or verifiable data. |
| Significant Energy Uses (SEUs) | Energy uses that account for substantial consumption or offer considerable potential for energy performance improvement. | Rank energy uses by consumption, energy intensity, operating control, improvement potential, and other defined criteria. | % of total energy use, MWh, or priority score | Prioritize monitoring, operational control, competence, maintenance, and improvement projects for high-impact uses. |
| Relevant Variables | Factors that significantly affect energy performance and should be considered when interpreting results. | Examples include production quantity, operating hours, weather, occupancy, product mix, and process conditions. | Variable-specific units | Use normalization, regression, or other documented analysis where raw energy totals could be misleading. |
| Peak Demand | The highest measured rate of energy demand during a defined interval. | Monitor interval electricity demand and identify maximum demand periods relevant to operations and tariffs. | kW or MW | Assess peak reduction, load shifting, equipment scheduling, and demand-response effectiveness. |
| Renewable Energy Share | The proportion of total energy consumption supplied by qualifying renewable sources. | Renewable share (%) = renewable energy consumed ÷ total energy consumed × 100. | % | Track separately from energy efficiency because a higher renewable share does not necessarily mean lower energy consumption. |
| Target and Action Status | The degree to which energy objectives, targets, action plans, and operational requirements are being achieved. | Compare actual EnPI results with approved targets and verify the completion and effectiveness of planned actions. | %, status, or completed actions | Use management review, internal audits, corrective actions, and documented evidence to evaluate effectiveness. |
It means more than using fewer kilowatt-hours. It measures reliability, demand, emissions, cost, and resource use. Numbers need context.
An energy performance indicator tracks results against a useful measure. Examples include kilowatt-hours per tonne, square metre, or production hour. Choose measures that match operations.
A baseline shows whether improvement is genuine. It should reflect weather, occupancy, schedules, production, and equipment loads. A perfect baseline is rare.
A cold week can increase heating demand. A quiet production month can create false savings. Compare results with relevant operating conditions.
Use at least twelve months of interval data when possible. Include meter readings, operating schedules, occupancy, maintenance records, and control logs. Missing meters remain a serious weakness.
Energy-use intensity compares annual energy use with floor area or another activity measure. For example, a 50,000-square-foot office using 95 units per square foot needs review. The comparison should include similar buildings and adjusted conditions.
Yes. A modeled design result is not an operating guarantee. Daily use may reveal weak controls, poor maintenance, tenant loads, or incomplete occupancy records. That is uncomfortable, but useful.
Check outages, recovery time, temperature variation, pressure stability, and equipment availability. A winter morning can expose problems hidden by annual averages. Small interruptions matter.
Exergy shows whether high-quality energy is being used unnecessarily. Demand analysis reveals sharp peaks, oversized equipment, and weak controls. I sometimes trust clean spreadsheets too quickly. Field data deserves skepticism.
Separate utility charges, maintenance, labor, replacement, and downtime costs. A low energy bill may hide expensive repairs. The cheapest-looking result may not be the best one.
Energy system performance describes how effectively an energy system converts inputs into useful services while controlling waste, cost, emissions, and operational risks. This article explains how to evaluate performance through the principles of ISO 50001 and energy intensity, then introduces practical indicators such as Energy Use Intensity (EUI), coefficient of performance (COP), capacity factor, and system losses. These measures help reveal whether equipment and facilities are operating efficiently under real conditions.
The evaluation also considers reliability, exergy, carbon emissions, energy costs, and peak demand, providing a broader view than efficiency alone. Results can be compared with ASHRAE 90.1 requirements and relevant sector energy-use data to identify performance gaps. Finally, the article presents an improvement approach based on systematic monitoring, operational adjustments, maintenance, and optimization, with a 10% energy-saving target as a practical benchmark for continuous performance improvement.